
Hello CWU Craft Brewing community! If you don’t know me, my name is Alexander Cleary and I am a 5th year senior (been too long i know, I just love it here so much) undergraduate student here at Central Washington University.
My major is Biology, but I am completing double minor in Chemistry and craft brewing like everyone should do naturally if presented the opportunity.
Currently I am taking practicum credits and setting up a Real-Time yeast fermentation apparatus/machine.
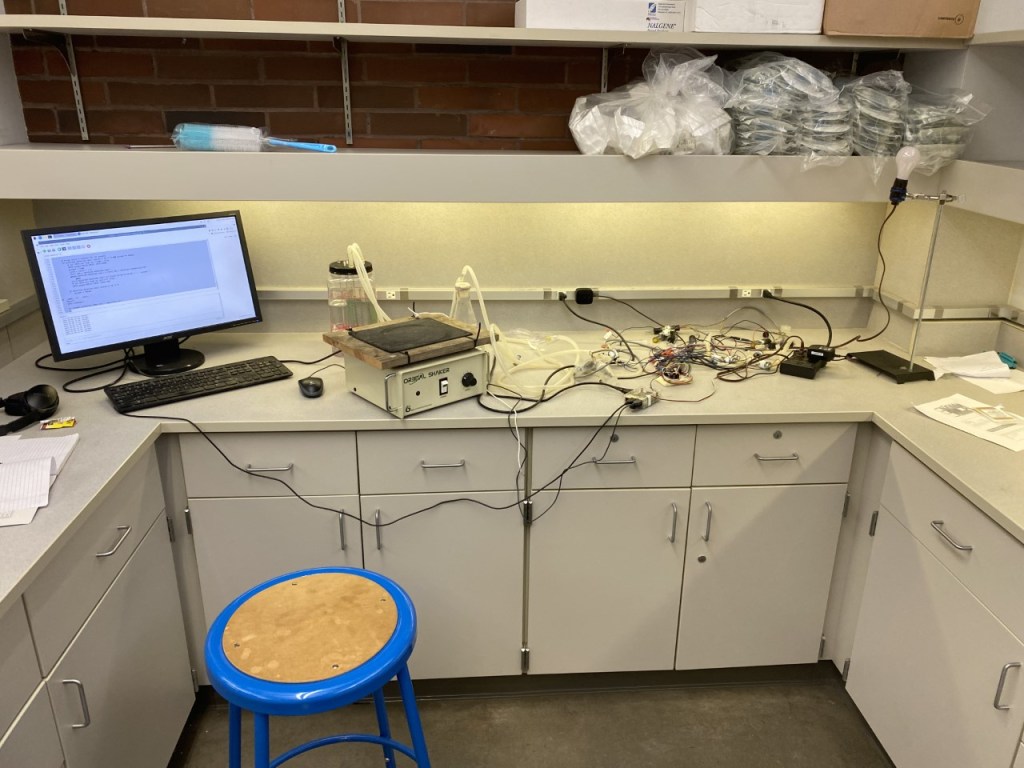
The apparatus runs through a raspberry Pi which is a miniature computer. The raspberry Pi is connected to the monitor, but also a circuit board which is connected to solenoid valves, and pressure sensors through wiring. The pressure sensors sit inside small airlocked 50ml centrifuge tubes sealed by putty. The tubing has a triangle piece which connects a solenoid valve, pressure sensor and tubing to volume control all back to a large beaker which is airlocked and contains wort with yeast. There are 8 working pressure sensors which also record temperature. The solenoid valves allow the build-up of carbon dioxide from the yeast to build for ten minutes and then a python script cycles and opens the valves every ten minutes on the minute.
What we are currently using to collect data is an approximately 1000ml / 1L beaker that we create airtight, with 500ml of wort and 1.45 grams of baker’s yeast.
We make sure to record Specific gravity before and after fermentation.
Using this set-up, we can measure fermentation kinetics of yeast in real-time. The raspberry pi run data script collects pressure build-up every second. All the data is then transferred to an excel data sheet.

This data set is huge and very annoying to work with and out of my league. To work around this, I am currently working on a second python script from home!

This python script takes the excel data and organizing the data by desired variables such as cycle, seconds, pressure sensor 4 (wort with yeast) and pressure sensor 6 (control-water). It takes these variables and groups them by each cycle. Using those groupings, it plots out each cycle with time(s) on the x-axis and Pressures for both pressure sensors on the y-axis.
Here is a video of me running the code in real-time (there are 439 cycles, so I stopped it early).
Running the python program, I coded at home. It is not a splendid video I know…
We can take this new organized data and solve for slope of each cycle. Then using Ideal Gas Law, PV=nRT we can directly solve for Carbon dioxide produced by the yeast over time, so the rate of fermentation. Pretty impressive.
For future projects you could set up two different strains of yeast and theoretically evaluate each strain to see which strain will ferment your beer recipe more efficiently.
There is still much to be desired of the project and I imagine I will still be coding and experimenting into spring quarter. I am excited to see what the future holds for this machine and the experiments that could be run for the CWU craft brewing program!
I must give credit where credit is due. Dr. Eric Graham set up all of this by himself and is merely letting me mess around with it (I flooded one of the pressure sensors by accident a couple of weeks ago…). He is the real genius behind this entire project. Most, if not all, of this is Dr. Eric Graham; he has helped me so much throughout this whole project and might have to some more because I am confused again as to what else I should code for…. *Cough* *Cough* Dr. Graham please help me I am stuck again.
