Background
This project started very ambitiously with the intent to see the effect of different levels of hydration in the dough. I started the process with three levels of hydration: 80%, 100%, and 120%. By hydration I mean the percentage of water content to flour content. For example, if I had 1000g of flour and 800g of water this would be 80% hydration. This resulted in a messy flour soup for the two higher hydrations and after baking didn’t result in anything that resembled bread. I then adjusted my hydration levels to a lower spread of 70%, 75% and 80%. This yielded much better results for the 2nd method, so I moved on to the third round of baking which was then blind taste tested. I will discuss the methods used in the preparation of the dough, as well as the blind taste test, and then finish with my pictures of the final process. I hypothesized that there would be no statistical difference in liking between the hydration levels.
Preparation
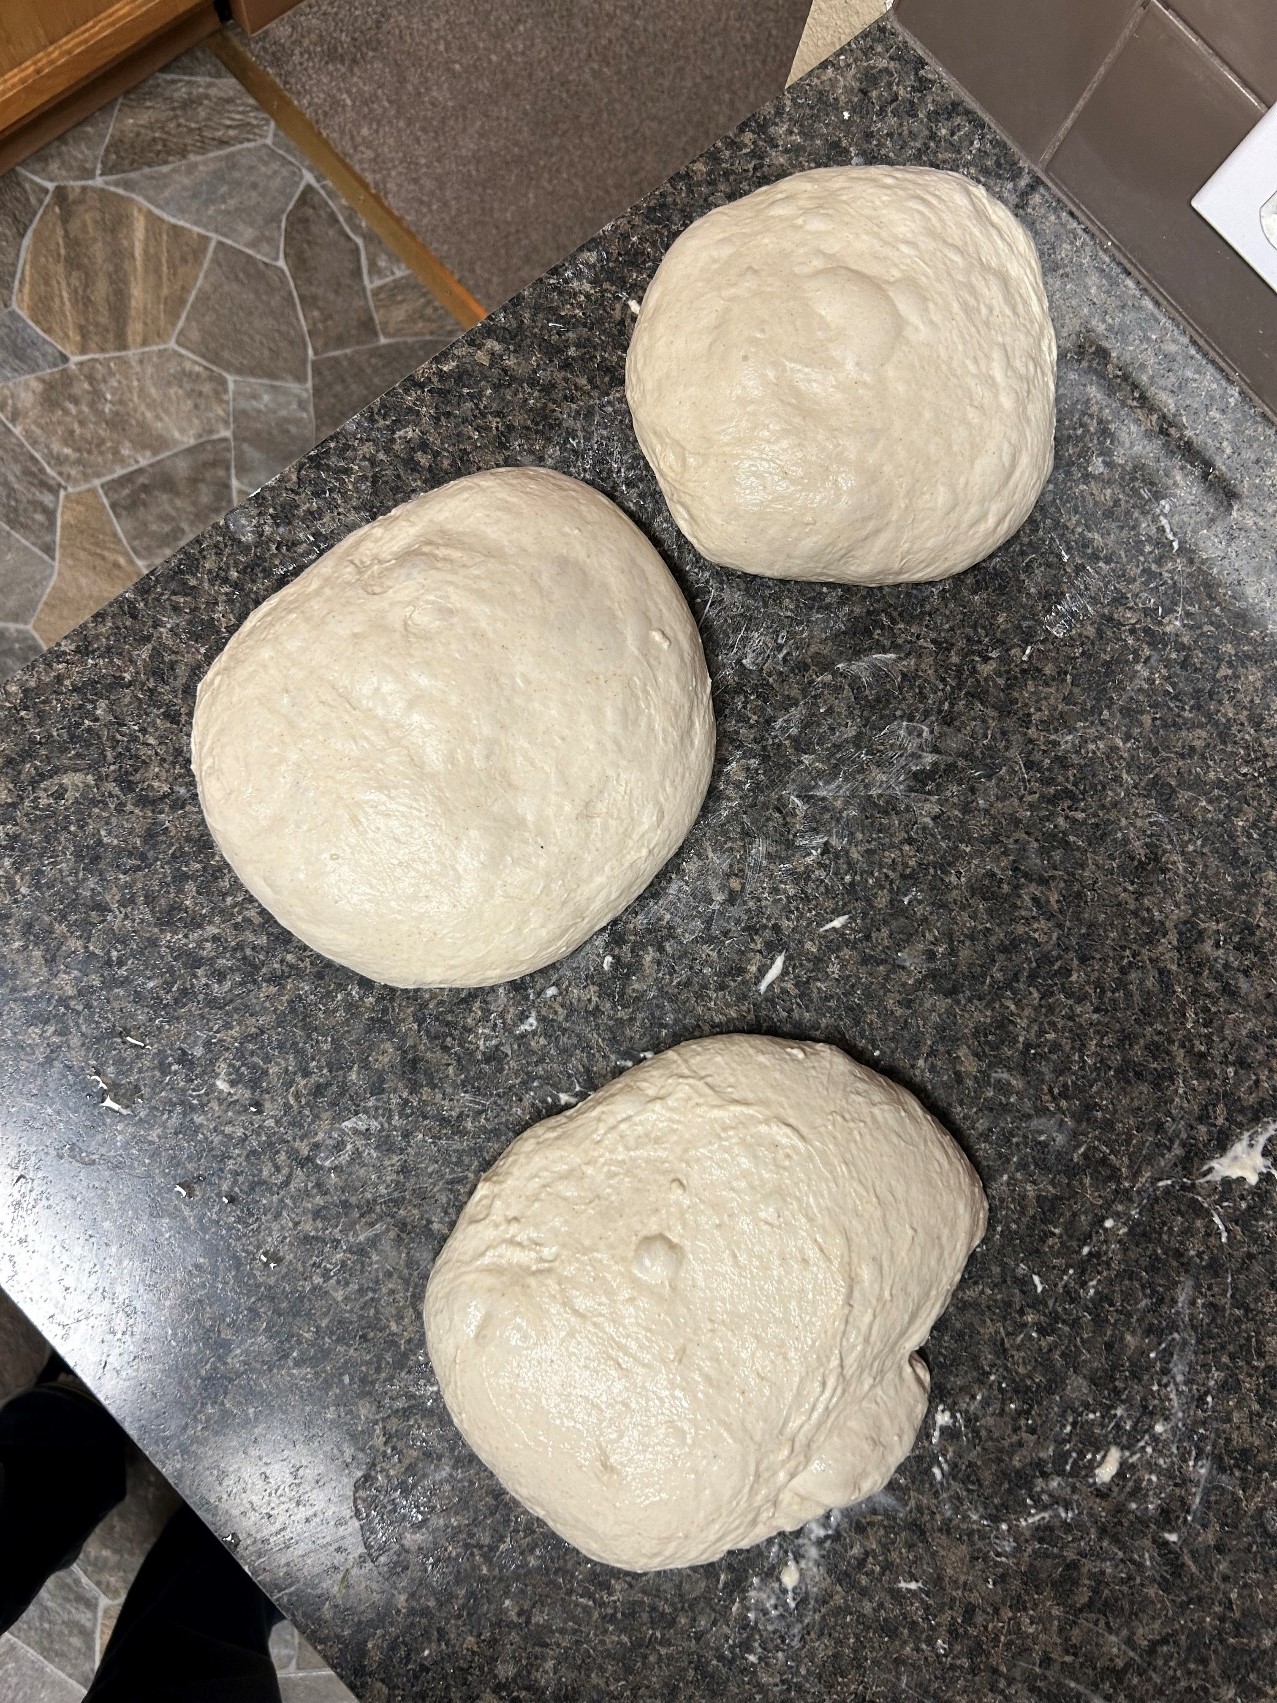
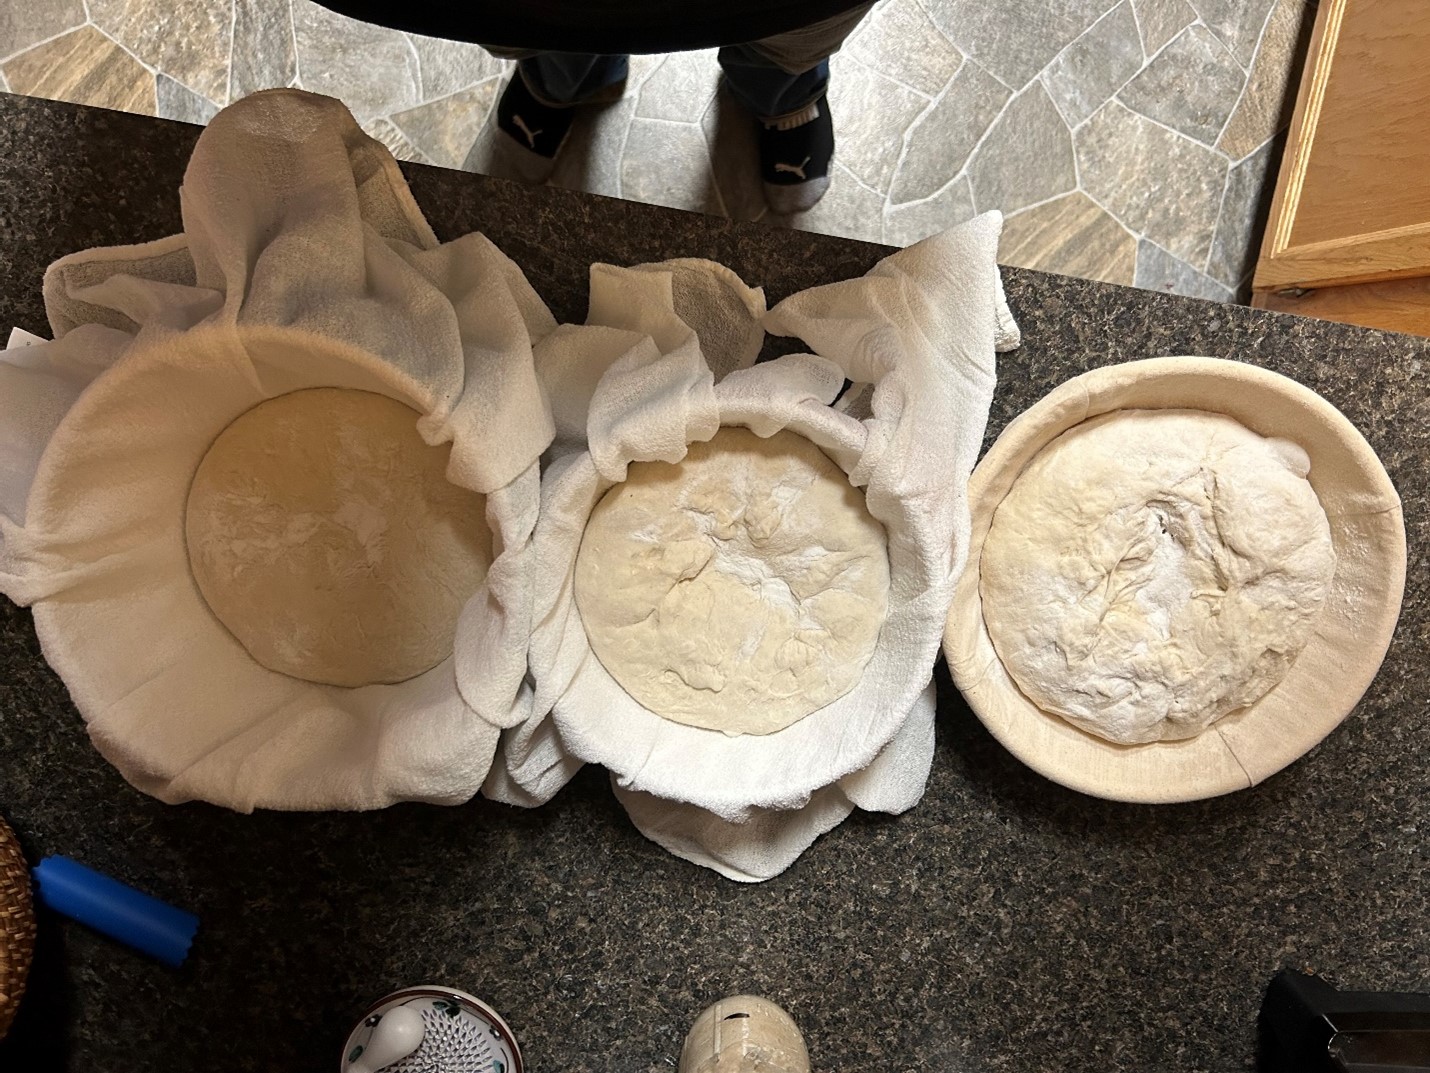
The process of sourdough always begins with the starter. I chose to start a new starter at the beginning of the process. This seemed to be a challenge for me for the rises that I was hoping to get out of my dough, so I ended up adding one packet of commercial yeast into my jar of 800g of starter. I then used 300g of this starter divided evenly across three doughs, so 100g each. I then added water temped at 80F for the respective hydration levels to each dough, for 70% I added 350g, for 75% I added 375g, and for 80% I added 400g. I then added to each dough 500g of flour, 30g of honey, and 11g of salt then mixed. I let the mixture proof for an hour then performed 4 rounds of stretch and folds to add strength to the dough, with 30 minutes of proofing in between the folds. Following the folds I then let the dough proof for another hour and then started the first round of shaping. Letting the dough rest for another hour I then performed the final shaping, placed the dough in the banneton, and cold-proofed it in the fridge overnight.


Baking Process
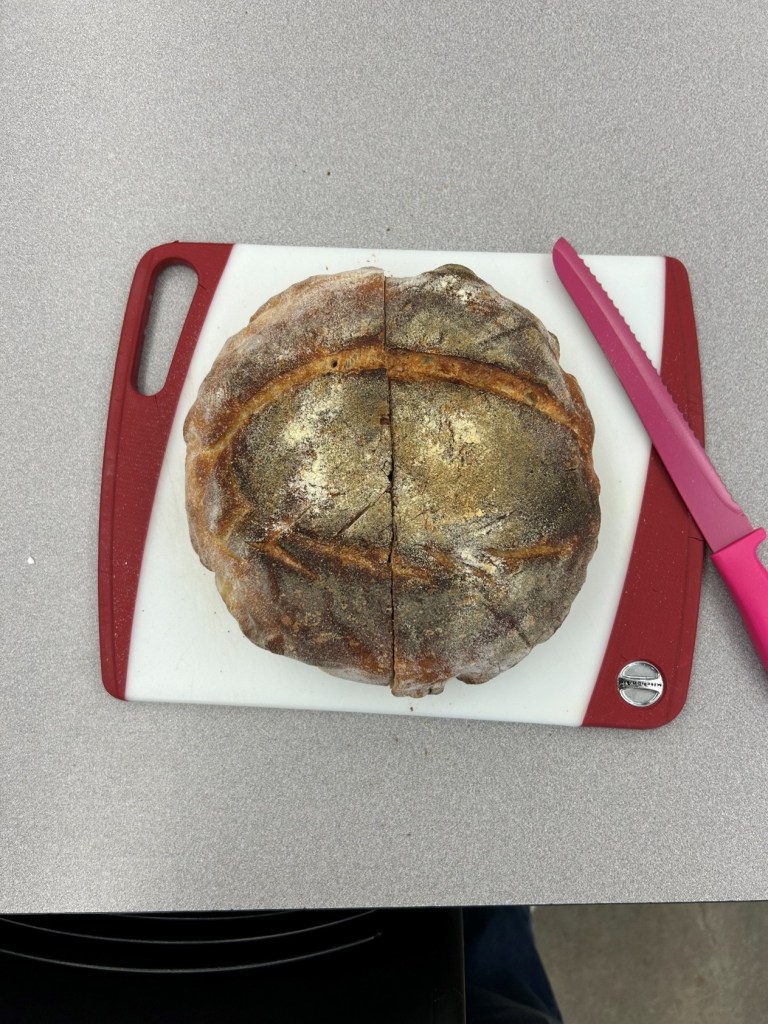
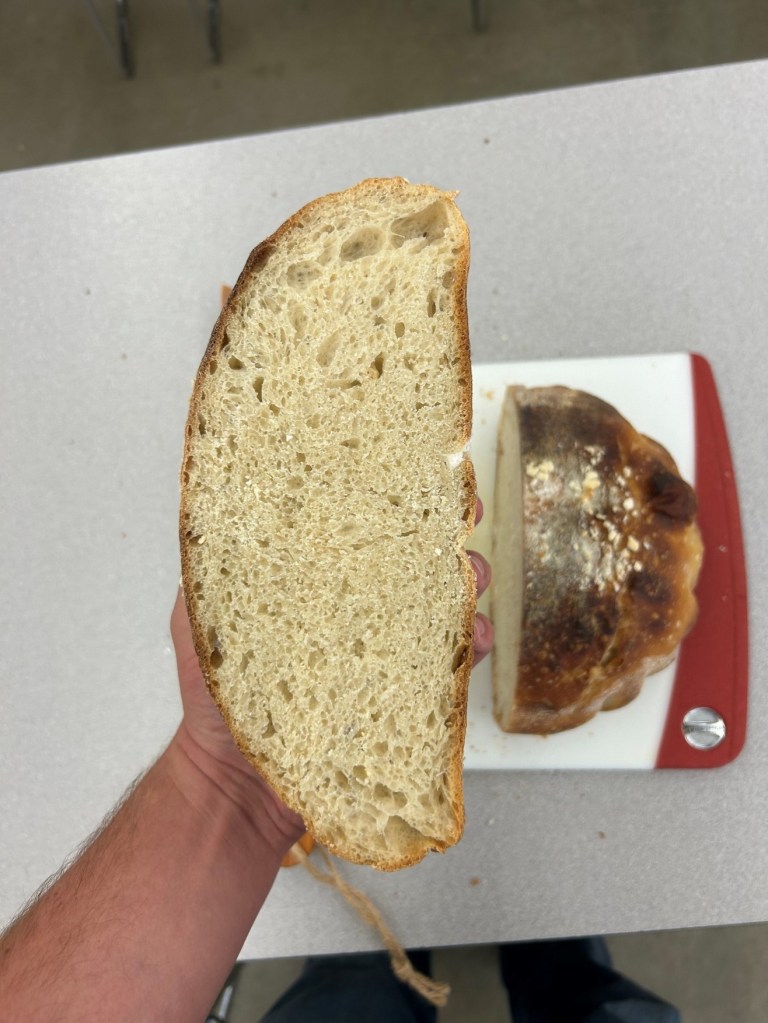
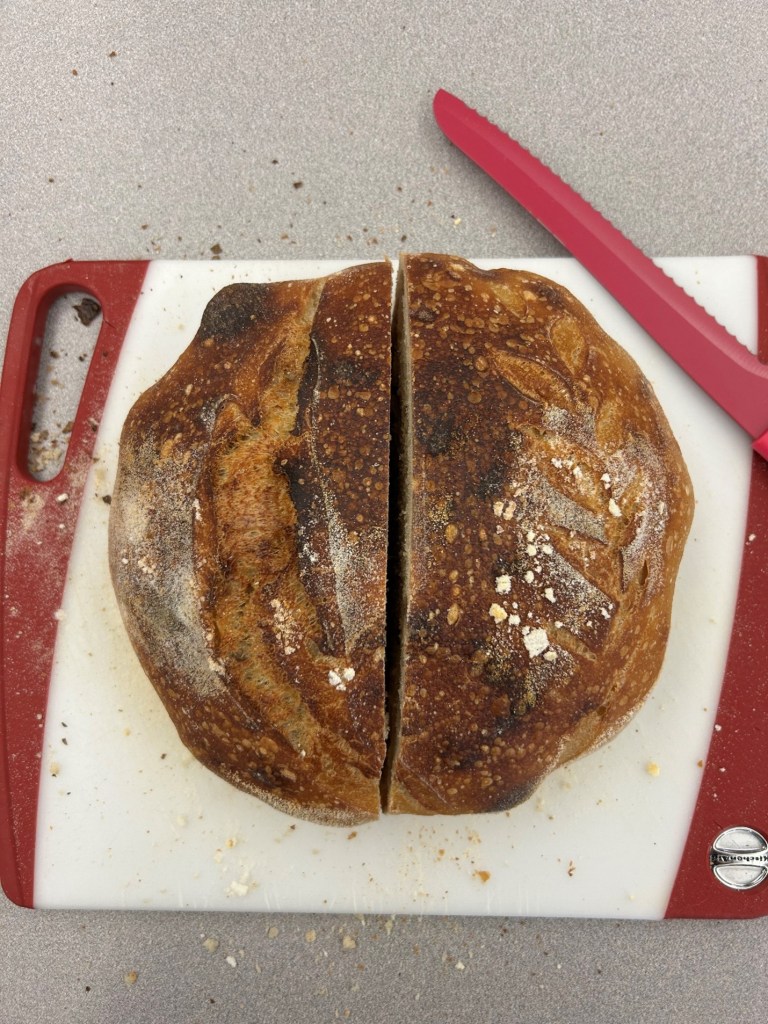
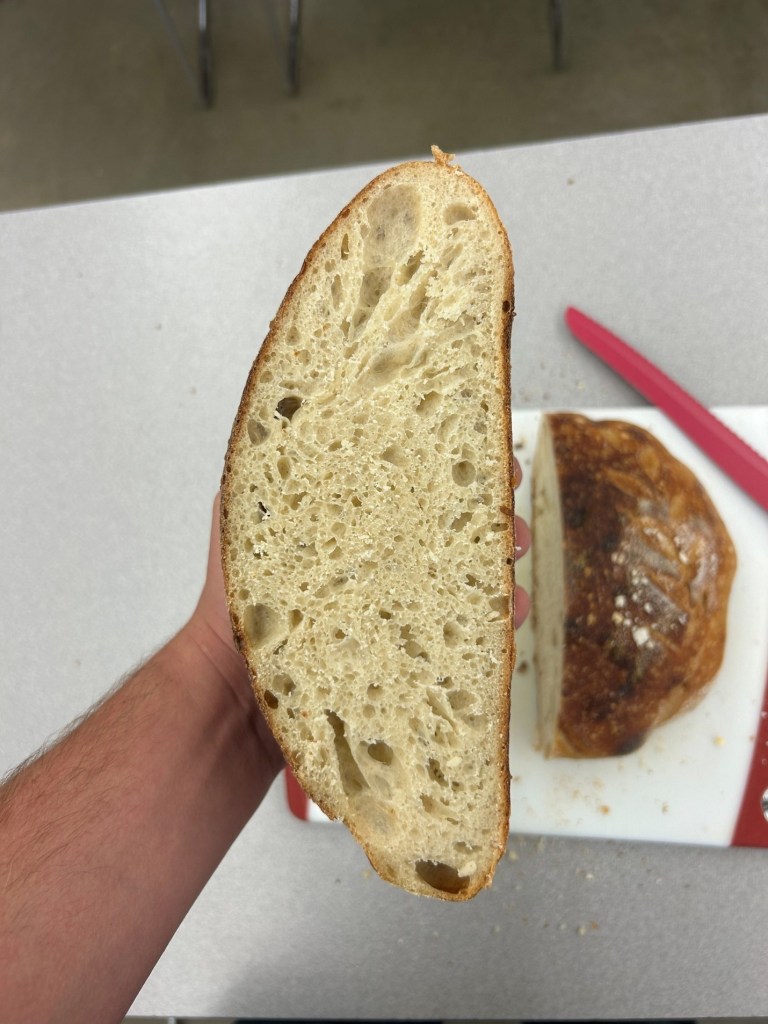
After cold-proofing the dough overnight I preheated the ovens to 500°F and placed the Dutch ovens in the oven. I let both the Dutch and the oven come to temp over an hour just to make sure we had an even temp. I then scored the doughs and placed them in the Dutch ovens as quickly as possible. I baked all the dough for 15 minutes covered then removed the lids of the Dutch ovens. After about another 10 minutes I temped the doughs progressively until they reached an internal temperature of 200°F. I placed the now-baked breads on wire racks to cool, labeled respectively of course. I then let them cool openly for about a day.


Sensory Analysis
To do the blind test I assigned each bread a random three-digit number, and then randomly allocated the three-digit number to either Group A, B, or C. The 70% hydration loaf was Group B and was assigned the number 167. The 75% hydration loaf was Group A and was assigned the number 725. The 80% hydration loaf was Group C and was assigned the number 986. I then took each participant and assigned them to a tasting order, For example, participant A’s order would be B,A,C; Participant B’s order would be C,A,B; and so on. We gave 8 participants samples in their order asking them to perform a hedonic test.
The hedonic test was conducted on a scale of 1-9; 1 being dislike extremely and 9 being like extremely. Treatment B (aka 70% hydration) had a mean of 7.5 with a standard dev. of 0.93. Treatment A (75% hydration) had a mean of 6.38 and a standard dev. of 1.69. Treatment C (80% hydration) had a mean of 7.38 with a standard dev. of 0.92.
Conclusions
My hypothesis was correct. I don’t think that the results constitute a statistical difference between the different hydrations. Being ranked 70%, 80%, and 75% accordingly. However, it was interesting to see the different likings and I believe with a larger sample size we might be able to see a better result. All and all I think if I had more time, I would bake several loaves of each hydration and hopefully gain a larger sample size. However, for the time being, I don’t think there is enough evidence to say that the hydration level affects the liking or disliking of the bread with any statistical significance.
